Getting Started with Open Telemetry on Kubernetes
This guide provides instructions on monitoring an application.
-
The monitored application/workload running in cluster A.
-
The SUSE® Observability Agent telemetry gateway running in cluster A, receiving OTLP data from the observed application(s) and sending it to SUSE® Observability.
-
SUSE® Observability running in cluster B, or SUSE Cloud Observability.
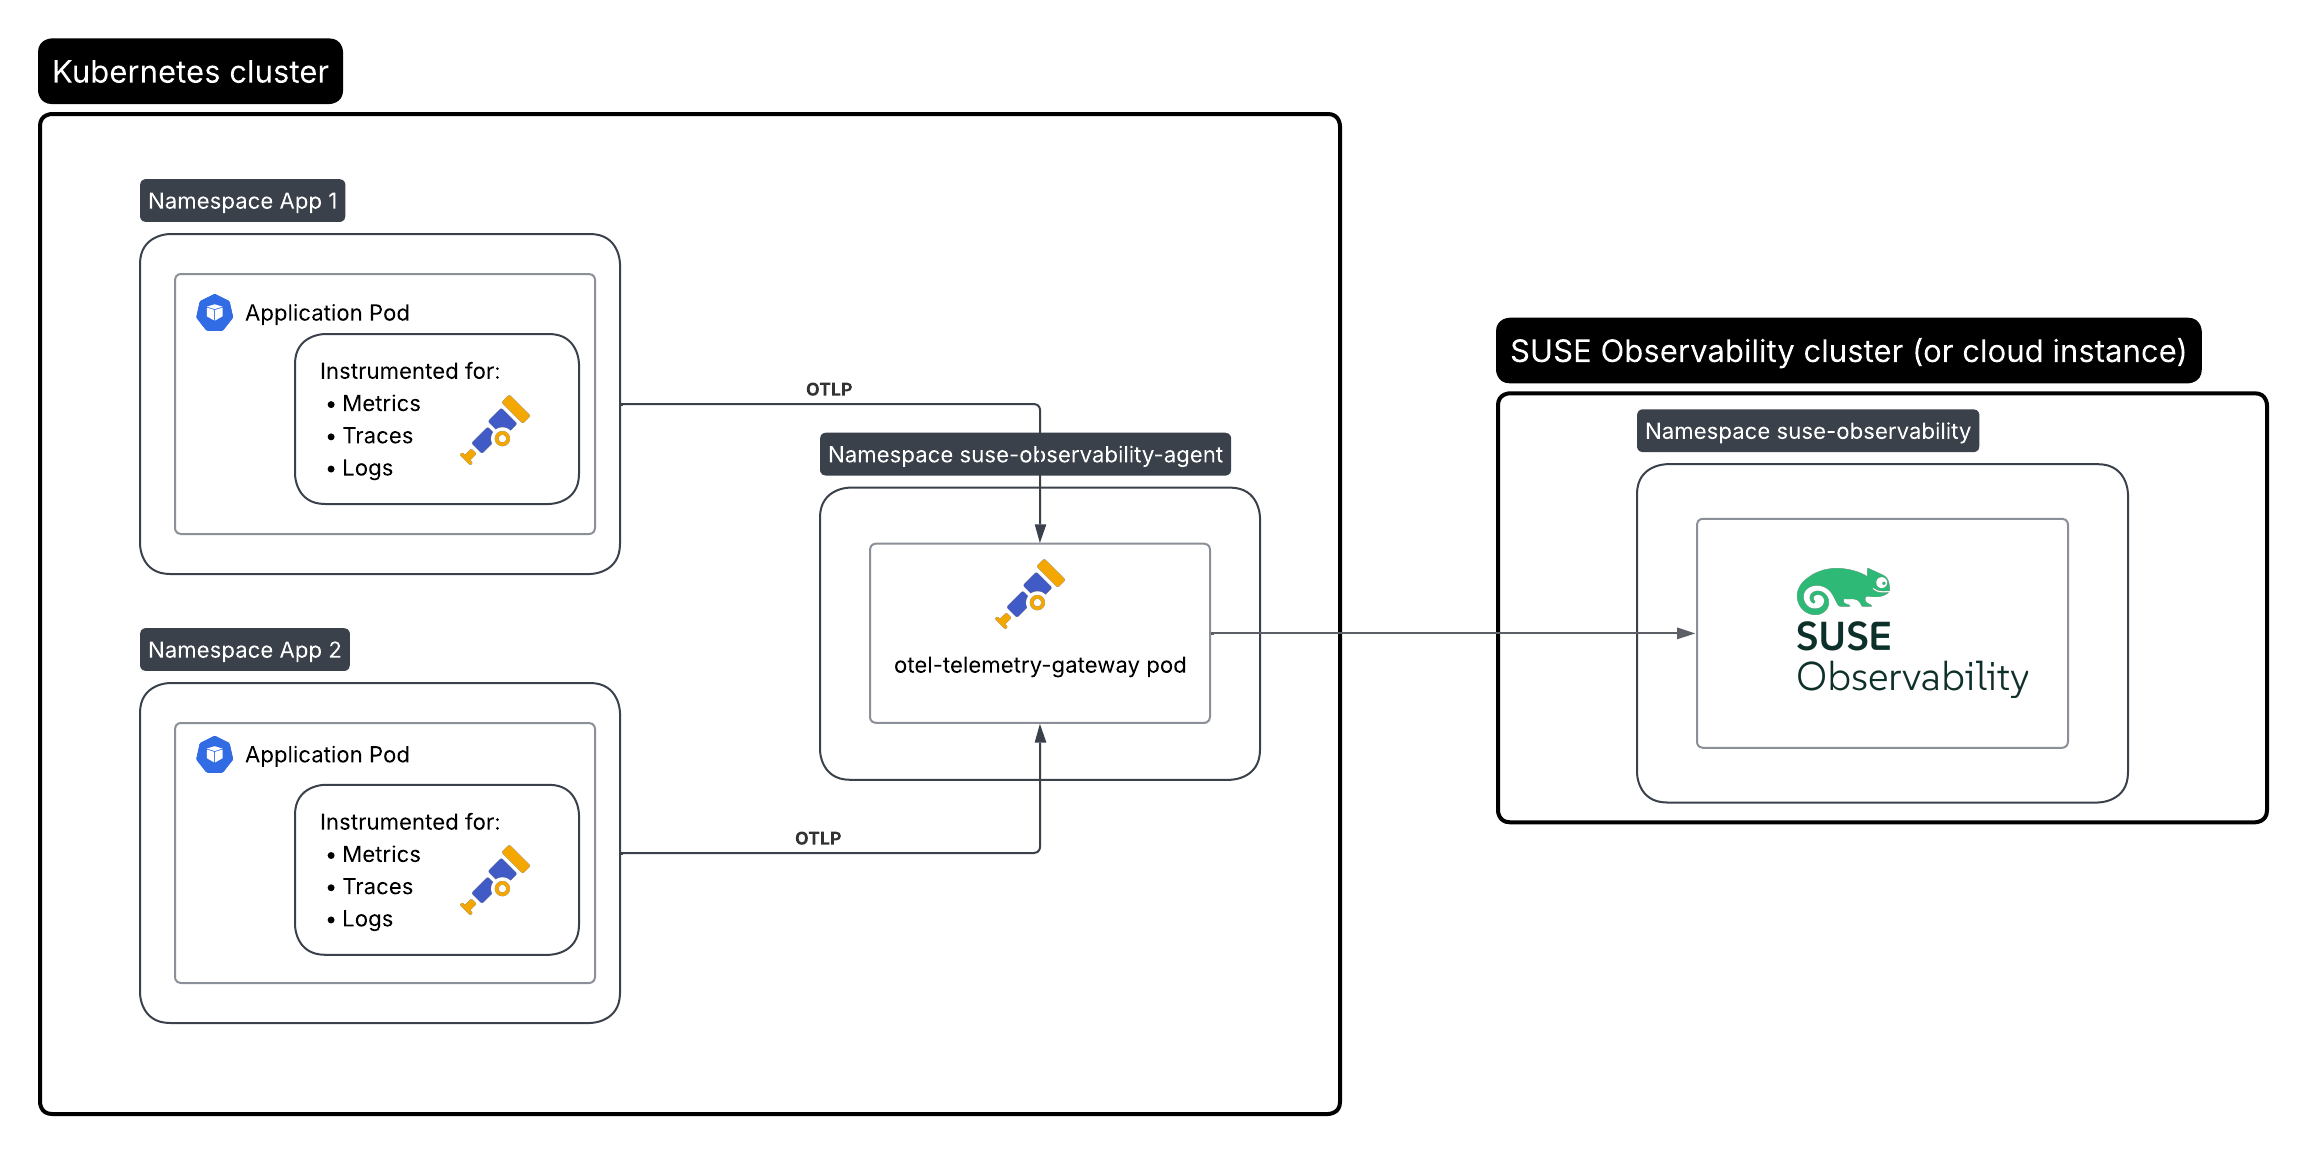
Recommended path: SUSE® Observability Agent telemetry gateway
|
The SUSE® Observability Agent telemetry gateway is the recommended path for Kubernetes workloads that are already instrumented with Open Telemetry SDKs. |
Enable the OTel pipeline and the SUSE® Observability Agent telemetry gateway in your SUSE® Observability Agent values:
otel:
  enabled: true
  telemetryGateway:
    enabled: true
Then point your application SDKs at the SUSE® Observability Agent telemetry gateway service. By default this is suse-observability-agent-otel-telemetry-gateway in namespace suse-observability-agent.
|
If your workloads expose Prometheus / OpenMetrics endpoints and are not instrumented with an OpenTelemetry SDK, use the scrape-based path instead: Scraping OpenMetrics with ServiceMonitor and PodMonitor. |
Set the following environment variables on your application pods:
OTEL_EXPORTER_OTLP_ENDPOINT=http://suse-observability-agent-otel-telemetry-gateway.suse-observability-agent.svc.cluster.local:4317
OTEL_TRACES_EXPORTER=otlp
OTEL_METRICS_EXPORTER=otlp
OTEL_LOGS_EXPORTER=none
OTEL_SERVICE_NAME=<your-service-name>
For HTTP/protobuf configuration, POD_UID downward API injection, attribute ownership, network policy requirements, and scaling guidance, see Configure your SDKs, Attribute ownership, Network policies, and Scaling.
Collect telemetry data from your application
The common way to collect telemetry data is to instrument your application using the Open Telemetry SDK’s.
For other languages follow the documentation on opentelemetry.io and configure the SDK exporter to ship data to the SUSE® Observability Agent telemetry gateway by following these instructions.
View the results
Go to SUSE® Observability and make sure the Open Telemetry Stackpack is installed (via the main menu -> Stackpacks).
If your pods are getting traffic, you should be able to find them under their service name in the Open Telemetry -> services and service instances overviews. Traces appear in the trace explorer and in the trace perspective for the service and service instance components. Span metrics and language specific metrics (if available) become available in the metrics perspective for the components.
If you also have the Kubernetes stackpack installed the instrumented pods will also have the traces available in the trace perspective.
Rancher RBAC
For Rancher RBAC to work, telemetry data needs to have the following resource attributes present:
-
k8s.cluster.name- the Cluster name as used by the Kubernetes stackpack -
k8s.namespace.name- a Namespace managed by a Rancher Project
With the SUSE® Observability Agent telemetry gateway path in this guide, these attributes are enriched by the gateway and sourced from Kubernetes metadata.
Next steps
You can add new charts to components, for example, the service or service instance, for your application, by following our guide. It is also possible to create new monitors using the metrics and setup notifications to get notified when your application is not available or having performance issues.